Dealer Margin Structure in Plywood
Business insights. Understanding the dealer and retailer margin structure in the Indian plywood trade. Profitability analysis for 2025.
Navigating the Plywood Supply Chain: Where Margins Emerge
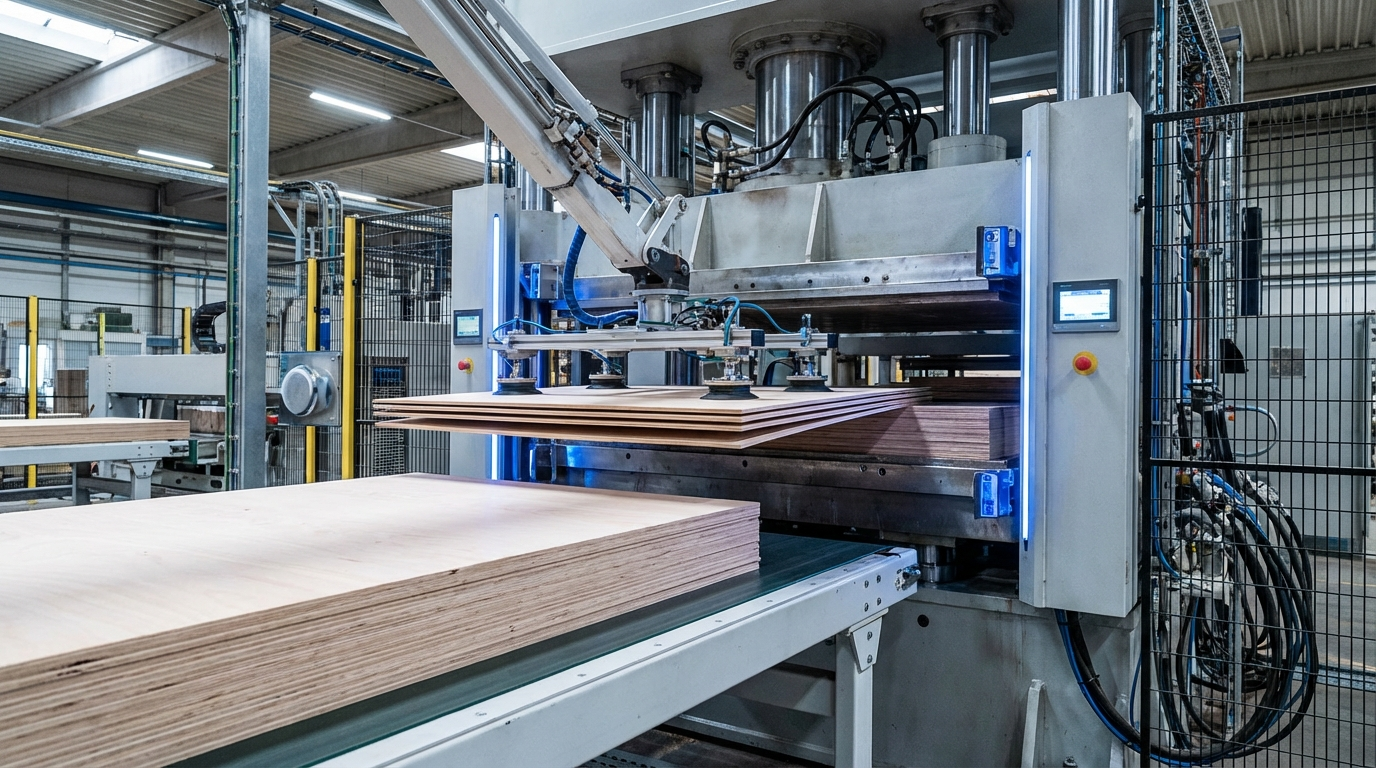
In India's plywood market, the path from mill to end-user involves multiple intermediaries, each capturing value based on risk, volume handled, and market access. Manufacturers produce raw plywood sheets, passing them to stockists or primary dealers who manage bulk logistics across states. These dealers supply sub-dealers or retailers, who then serve contractors, carpenters, and homeowners. This layered structure—common in tier-2 and tier-3 cities—arises from fragmented demand, regional raw material sourcing (like poplar in Punjab or rubberwood in Kerala), and the need for credit extension amid construction cycles tied to monsoons and festivals.
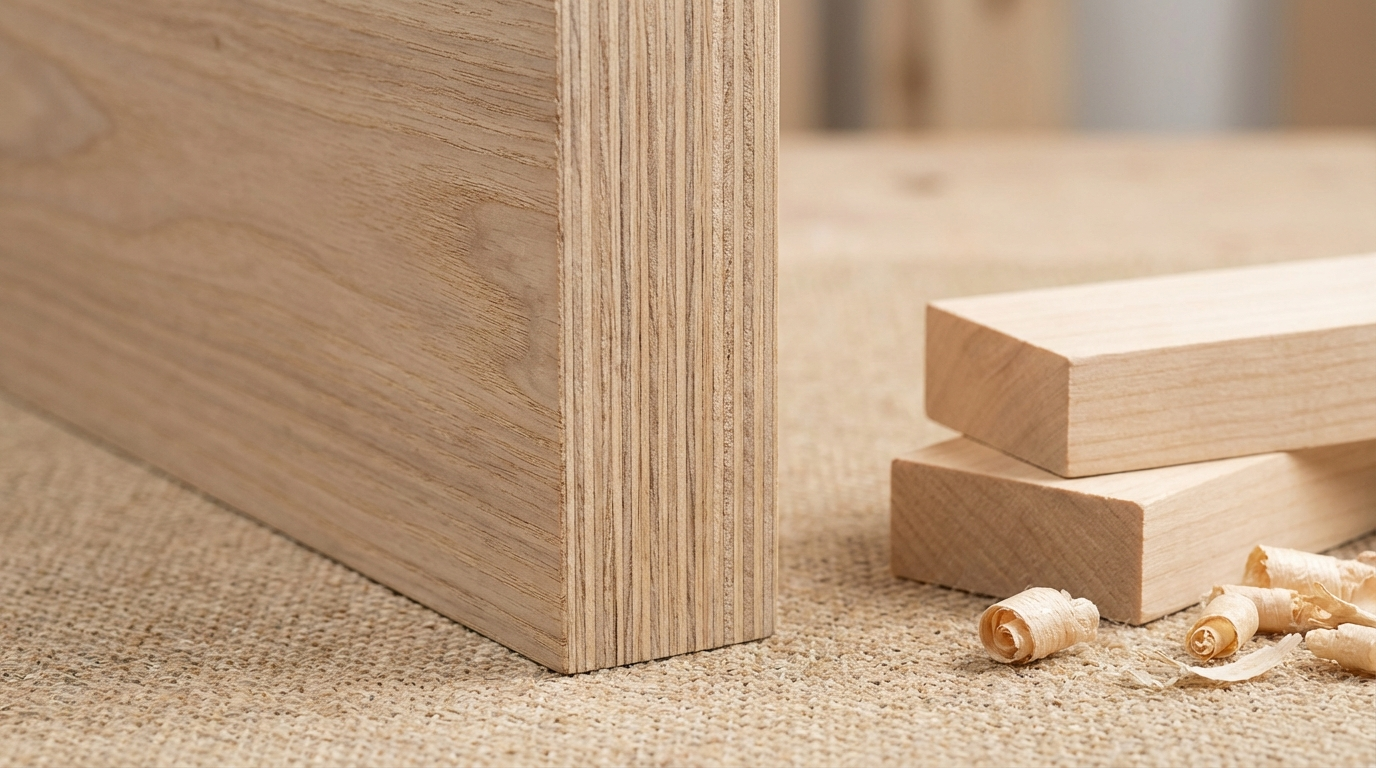
Margins form at each step as a buffer against price volatility in adhesives, timber, and transport fuels. Unlike direct-to-consumer goods, plywood's bulk nature (8x4 ft sheets weighing 30-60 kg) favors volume players, compressing margins for low-turnover outlets. Understanding this chain reveals why a dealer in Gujarat might net differently from one in Bihar, driven by proximity to mills and buyer credit terms.
Dealer vs Retailer: Distinct Roles Shaping Margin Expectations
Dealers operate as wholesalers, buying in truckloads (500-2000 sheets) directly from mills or authorized distributors. Their role centers on storage, credit to retailers (often 30-90 days), and intra-state distribution. Retailers, conversely, handle smaller volumes (50-200 sheets per order), focusing on last-mile delivery, cutting-to-size services, and direct sales to fabricators or DIY buyers.
This distinction dictates margin profiles: Dealers prioritize turnover over per-unit gain, absorbing bulk discounts but facing inventory risks from seasonal slumps. Retailers leverage higher per-sheet markups through value-adds like lamination previews or urgency premiums during peak Diwali renovations. In practice, a dealer might hold 20-30% of total chain margins, with retailers claiming the rest, varying by urban density—higher in Mumbai suburbs than rural Uttar Pradesh.
Core Responsibilities and Risk Allocation
- Dealers: Bulk procurement, GST-compliant invoicing, credit risk on retailer defaults (common in contractor-heavy markets).
- Retailers: Customer-facing demos, waste management from cuts, bad debt from homeowners delaying payments post-installation.
Breaking Down Typical Margin Structures Across the Trade
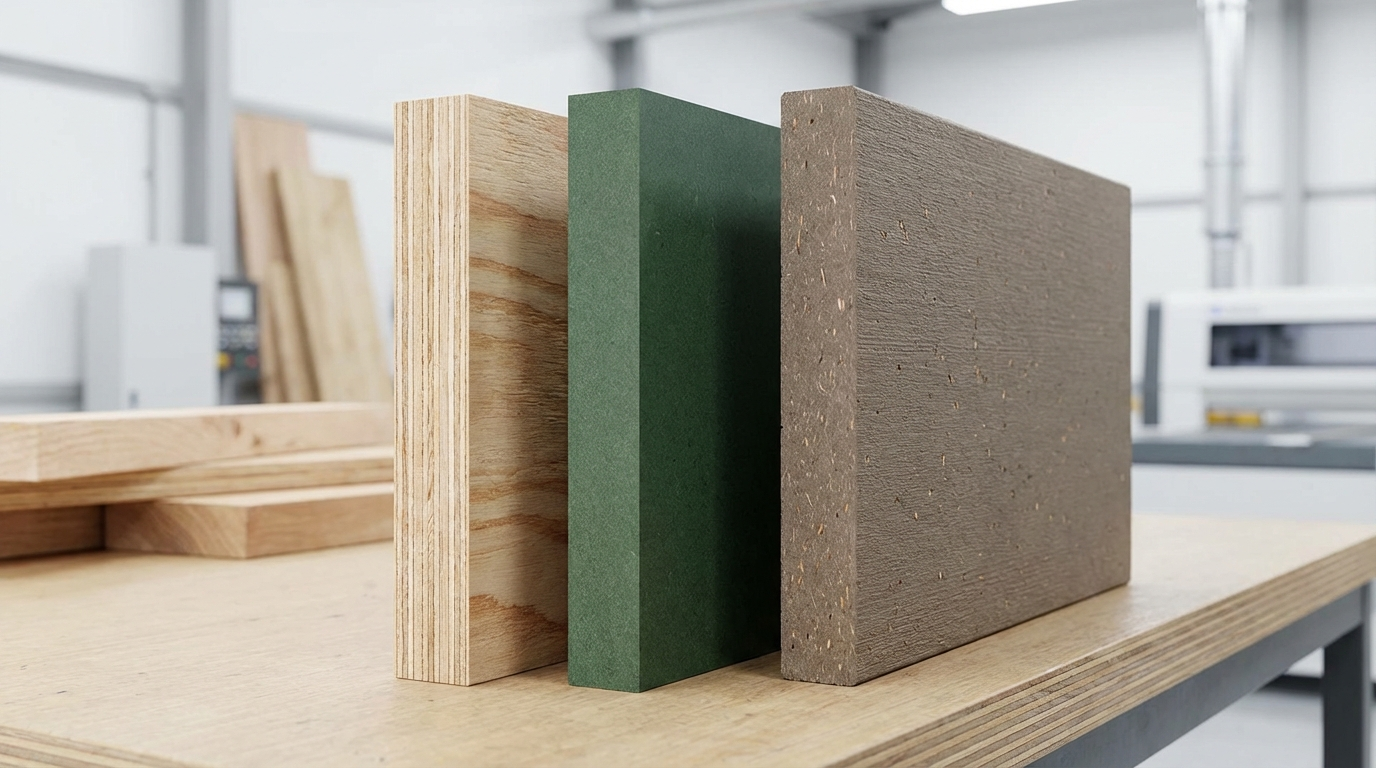
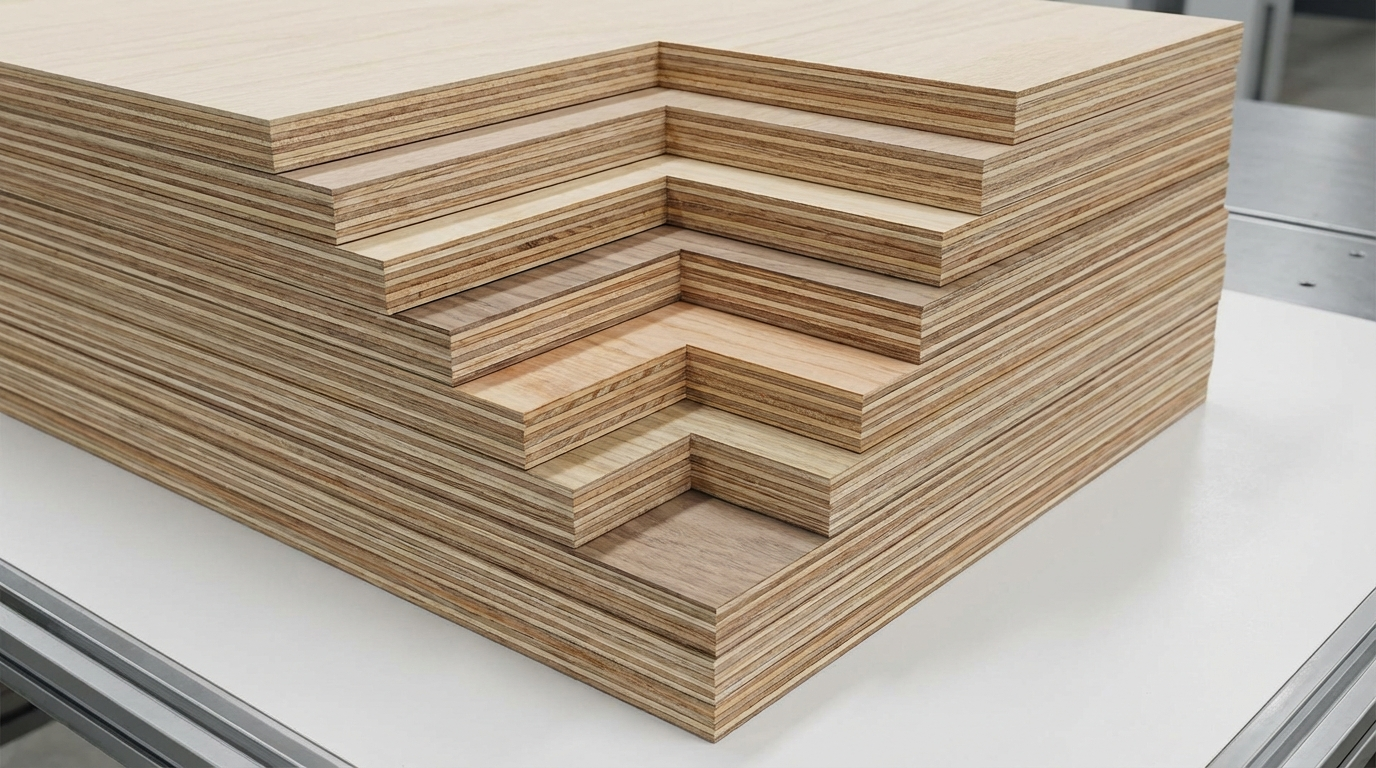
Margins in the Indian plywood trade layer cumulatively from ex-mill pricing, reflecting product grade (MR for interiors, BWR for humid zones, BWP for coastal exteriors) and thickness (6-25 mm). Ex-mill costs form the base, with each intermediary adding 5-20% based on negotiation power and market tightness.
| Supply Chain Stage | Common Gross Margin Range | Key Influences | Example Scenario (MR Plywood, 18mm) |
|---|---|---|---|
| Manufacturer to Dealer | 8-12% (dealer purchase discount) | Volume commitment, mill capacity utilization | Dealer buys at Rs 2,000-2,500/sheet ex-mill |
| Dealer to Retailer | 10-15% | Credit period offered, transport inclusion | Retailer pays Rs 2,300-2,800/sheet |
| Retailer to End-User | 12-20% | Services like edging, local competition | Contractor/homeowner pays Rs 2,700-3,400/sheet |
| Total Chain Markup | 30-50% over ex-mill | Full stack, excluding GST (12-18%) | End price reflects regional freight variance |
Note: These ranges derive from observed trade practices; actuals fluctuate with raw material cycles (e.g., eucalyptus price spikes post-monsoon). Dealers often invoice net of discounts, netting 7-10% after logistics.
Factors Driving Margin Variations in Regional Contexts
India's plywood ecosystem fragments margins geographically. Northern markets (Delhi-NCR, Punjab) see tighter 8-12% dealer margins due to mill proximity and high competition from unorganized players. Southern hubs (Kerala, Tamil Nadu) allow 12-18% via export-grade BWP premiums and plantation control. Eastern regions face compression from import threats (Vietnam particleboard), pushing dealers toward hybrid stocking of MDF.
Product-specific dynamics amplify this: Commercial MR grade yields slimmer spreads (volume-driven), while marine BWP commands 15-25% dealer cuts for specialized buyers like shipyards. Thickness plays in—thinner 6mm flexi-ply for partitions nets higher relative margins than heavy 25mm shuttering for construction sites.
Volume, Credit, and Competition Interplay
High-volume dealers (monthly 10,000+ sheets) negotiate 2-5% extra from mills, but extend 60-day credits eroding cash flow. Intense rivalry in Tier-1 cities caps retailer markups at 10-12%, forcing diversification into HDHMR for modular kitchens.
2025 Profitability Analysis: Trends Reshaping Dealer Viability
Looking to 2025, plywood dealer profitability hinges on input cost stabilization amid global timber curbs and domestic afforestation pushes. Expect ex-mill prices to rise 8-15% from adhesive (urea-formaldehyde) hikes and logistics inflation post-fuel duty tweaks, squeezing base margins unless offset by premium grades.
Positive tailwinds include urban housing boom (PM Awas Yojana extensions) boosting BWR demand in humid belts, potentially lifting retailer end-margins to 15-22%. However, engineered alternatives like HDHMR erode MR plywood volumes by 10-20% in interiors, compelling dealers to retrain sales teams. Regional shifts: North India dealers may see 5-10% profitability dip from overcapacity; South holds steady via exports.
| Trend | Impact on Dealer Margins | 2025 Projection | Mitigation Angle |
|---|---|---|---|
| Raw Material Volatility | Downward pressure (5-10% erosion) | Moderate rise in poplar costs | Lock-in mill contracts |
| Regulatory Shifts (BIS enforcement) | Neutral to positive (quality premiums) | Stricter ISI on moisture content | Stock certified grades |
| Competition from Engineered Wood | Compression in low-end (MR) | HDHMR share doubles | Bundle offerings |
| Demand from Infra Projects | Upside (shuttering plywood) | 10-15% volume growth | Target contractors early |
Net outlook: Dealers averaging 8-12% net profitability in 2025, with top performers (diversified portfolios) hitting 15% via 20-30% turnover growth.
Operational Strategies for Margin Optimization
To counter 2025 headwinds, dealers should audit inventory turns (aim for 4-6x annually) and tier clients: Offer volume rebates to high-credit retailers while premium-pricing slow-payers. Integrate digital tools for real-time pricing (factoring GST, freight calculators) to capture 2-4% extra on spot sales.
Retailers benefit from site-specific bundling—pairing BWP with marine fittings for coastal projects—yielding 18-25% effective margins. Track mill certifications (IS:303 for MR) to justify premiums, avoiding commoditized trades. In credit-heavy markets, enforce partial upfronts (30%) to safeguard 2-5% of gross.
Decision Framework for Dealers
- Assess local chain depth: Shorten if possible via direct mill ties.
- Model scenarios: High-volume low-margin vs niche high-margin.
- Monitor macros: Timber auctions, monsoon forecasts for demand cues.
Conclusion: Positioning for Sustainable Trade Profits
Mastering plywood margins demands blending chain awareness with adaptive tactics. In 2025's evolving market, dealers thriving will those balancing volume scale against value differentiation, navigating India's diverse regional demands without chasing unsustainable spreads.
Want Plywood Suggestions?
Share a few details and a PlyPrice specialist will suggest suitable brands and connect you to responsive dealers.